


12
Jul
Daily Technical Analysis on 12th July 2016
Technical Pairs: EURUSD, GBPUSD, USDJPY, Brent-Crude Oil, & GOLD.
EURUSD
The firm US employment data very much supported the dollar. The labor market place sustained to encourage investors that the US financially keeps recovering. EURUSD pair has been trading in a matter for 3 weeks now. Monday the pair remained below pressure in the red line, EURUSD trades were neutral. The resistance seems in 1.1130, the support seems in 1.1050 levels.
Both the indicators show short positions. MACD zone is in negative that shown sellers’ strength. RSI is nearly to the oversold region. If the oscillator sustains to grow, it will be a buy signal. The moving average of 50, 100 and 200 directs downsides in the 4HR chart signs a sell signal. The price smashed the 50-EMA and 100-EMA tested which limited its movement in the 1HR chart. A downtrend will begin as soon as the pair cut down below the support level of 1.1000 which is a solid psychological level.
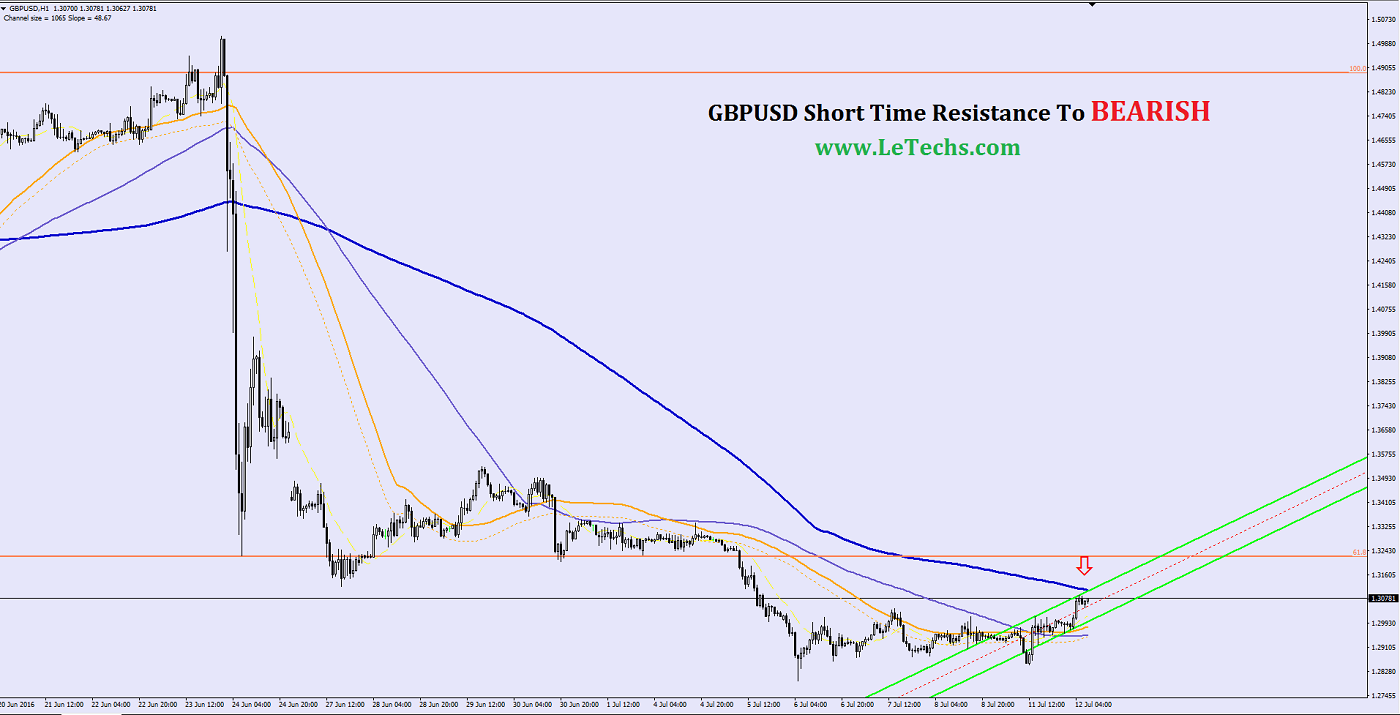
GBPUSD
The unexpectedly firm employment reports hard the US dollar across its key counterparts. The improved of the dollar forced the British pound. The BoE will meet this week & the controller might lower the rate from 0.50 percent to 0.25 percent. This news will have a high impact on the pound in the upcoming days. At present GBPUSD pair is a downward trend on the daily time frames. It is descending channel in 4HR chart. Monday the pair tested the mark level of 1.2840 but break down to fixate at it and returned over the level of 1.2900. The resistance seems at 1.3100 levels, the support remains at 1.2900 levels.
MACD is in the negative region. The indicator might cross the centerline upsides. If the indicator turns into the positive zone it will sign us a buy signal. RSI is correcting which is a buy signal. The moving average of 50, 100 and 200 is downward directions in the 4HR chart which signs a sell signal. The value cracked the 50 and 100 EMAs in the 1HR chart. Currently the 100-EMA acts as a resistance & doesn’t let the pound to strength.
The current bounce back of 1.2900 levels should be considered curative. These pair traded sideways although waiting for the fresh drivers. If the pair dominates to make a breakout level of 1.3100 it might grow towards 1.3300 levels. Once we smash under the 1.2900 level, we consider that the next level will be 1.2700.
USDJPY
Machinery Orders unexpectedly decline in Japan. The strong yen & weak demand cripple corporate profits & spending ideas in the country. The unexpected reduce of Machinery Orders hints a slowdown in the investments. USDJPY pair recovered & gained regarding 2.11 percent last day. The instrument blocked its mounting at the level of 102.80 areas. The resistance lies at 103.50; the support stands at 102.50 levels.
The 50, 100 & 200 EMAs are moving downsides in the 4HR chart which signs a sell signal. Monday the instrument smashed through the 50-EMA & 100-EMA downsides in the 4HR chart. Indicators are drifting in the green zone. MACD might cross the centerline upwards & move into the positive zone. Its movement will hint the buyers’ strength. RSI is nearly to the overbought region. If the oscillators sustain its growth it signs a buy signal. Buyers have the ball right now. We consider the growth will be constant. The pair might increase to the resistance level 103.50. After smashing 103.50 levels the buyers might leads to 104.50.
Brent – Crude Oil
All the investors are waiting for oil reports & Chinese GDP publication. The buyers tested to raise the oil price last day but declined to succeed. The Brent blocked around the 47th figures. Throughout the American session sellers recurred to the market place & the price cut down under the level of 46.50. The resistance remains in 46.50 & the support stays in 45.30 levels.
The indicators are in the red lines. Decreased MACD, RSI is near to the overbought region. If the indicator stays at the same levels, it will be a sell signal. The 50, 100 and 200 moving averages are moving downsides in the 4HR chart. The value is under the EMAs, it signs a sell signal. The Brent futures reached the 50-EMA & rebound downwards from it in the 1HR chart. If the value fixates under the level of 46.50, it might sustain the downward trend in the short term positions. The potential targets are 45.30 levels.
XAUUSD
On Yesterday, the yellow metal futures rose although trading to touch 28-months high. According to the market place rumors the Fed will stay cautious about its interest rates, despite the favor employment reports. Even though the values lost regarding 1.04 percent last day the yellow metal quotations stayed in the green region. The gold showed a less volatility on Yesterday. The value was trading between the levels 1355 & 1374. The resistance seems at 1360 & the support seems at 1330 levels.
The indicator looks a growth constantly on the Daily time frames. Decreased MACD shows the buyers’ weakness. RSI remains in neutral zone giving no signal. The 50, 100 and 200 EMAs are driving upsides in the 4HR which signs a buy signal. The yellow metal smashed the 50-EMA & cloaked at the 100-EMA in the 1HR chart. Currently the 100-EMA acts as a support for the pair. We wait the 1360 levels crack that will unlock the path for the buyers to 1390 levels. We do not ignore pull-backs to 1330 & 1300 levels.
Share This Post
 0
0
 0
0
 0
0


Categories
Forex Technical outlook
Forex Fundamental Outlook
Learn Forex Trading
Forex trading psychology
Forex technical indicator
General News

Popular

Why we choose Forex Market?
Oct 06 , 2015

Forex, Commodity and Binary Trading Signals on 5th May 2016
May 04 , 2016

Forex Trading Terminologies
Oct 21 , 2015

Recent

Forex Weekly Technical Outlook on 7-11 August 2017
Aug 07 , 2017

Forex Weekly Technical Outlook on 24-28 JULY 2017
Jul 24 , 2017

Forex Weekly Technical Outlook on 12 JUNE 2017
Jun 12 , 2017
Archives
August 2017
July 2017
June 2017
May 2017
April 2017
March 2017
February 2017
January 2017
December 2016
November 2016
October 2016
September 2016
August 2016
July 2016
June 2016
May 2016
April 2016
March 2016
February 2016
December 2015
November 2015
October 2015
September 2015
July 2017
June 2017
May 2017
April 2017
March 2017
February 2017
January 2017
December 2016
November 2016
October 2016
September 2016
August 2016
July 2016
June 2016
May 2016
April 2016
March 2016
February 2016
December 2015
November 2015
October 2015
September 2015


