


28
Oct
Daily Technical Analysis on 28 October 2016
Today’s Technical Pairs: EURUSD, GBPUSD, USDJPY & XAUUSD.
EURUSD
There were no key events on the schedule in the EU. The market was a focal point on Initial Jobless Claims and Durable Goods Orders publishes. The pair was weak during the Asian session on yesterday. The price reached the level 1.0900 where the downside momentum faded. The pair rebound the level and was adept to strengthen, reversing few losses in the European trades. According to 1HR chart, the value is over the 100-EMA which give a solid support for the euro. The 50 and 100 EMA remains neutral, although the 200-EMA is moving south.
The resistance comes in 1.0950 levels, the support lies in 1.0900 levels. Indicator MACD grew which hints the sellers’ spot weakening. RSI remains neutral.
GBPUSD
A good forecast of GDP report temporally supported the pound. The sterling was adept to strengthen across the board. Still, the US dollar quickly regained its losses, limiting the additional pound gains. The pair remained within a narrow range not too long from the 1.2200 support level throughout the day on yesterday. It's fresh recovery was clogged around the mark levels of 1.2150 which knocked off the rate downside. The pound spent the night at the 1.2200 levels maintained and little bit strengthened in the middle of the European session. The pair weakened in the US session.
The sterling bounced from the 50-EMA, around 1.2200 levels in the 1HR chart. The pair moved upside and smashed the 200-EMA in the 1HR chart. The 50 and 100 EMA remains neutral, although the 200-EMA is heading downwards. The resistance seen at 1.2300 levels, the support finds at 1.2200 levels. MACD is at the centerline. If the histogram moves into the positive zone that will indicate buyer’s strength increasing. If MACD comes back into the negative zone the sellers will take over the market control. RSI indicator moved towards the oversold region.
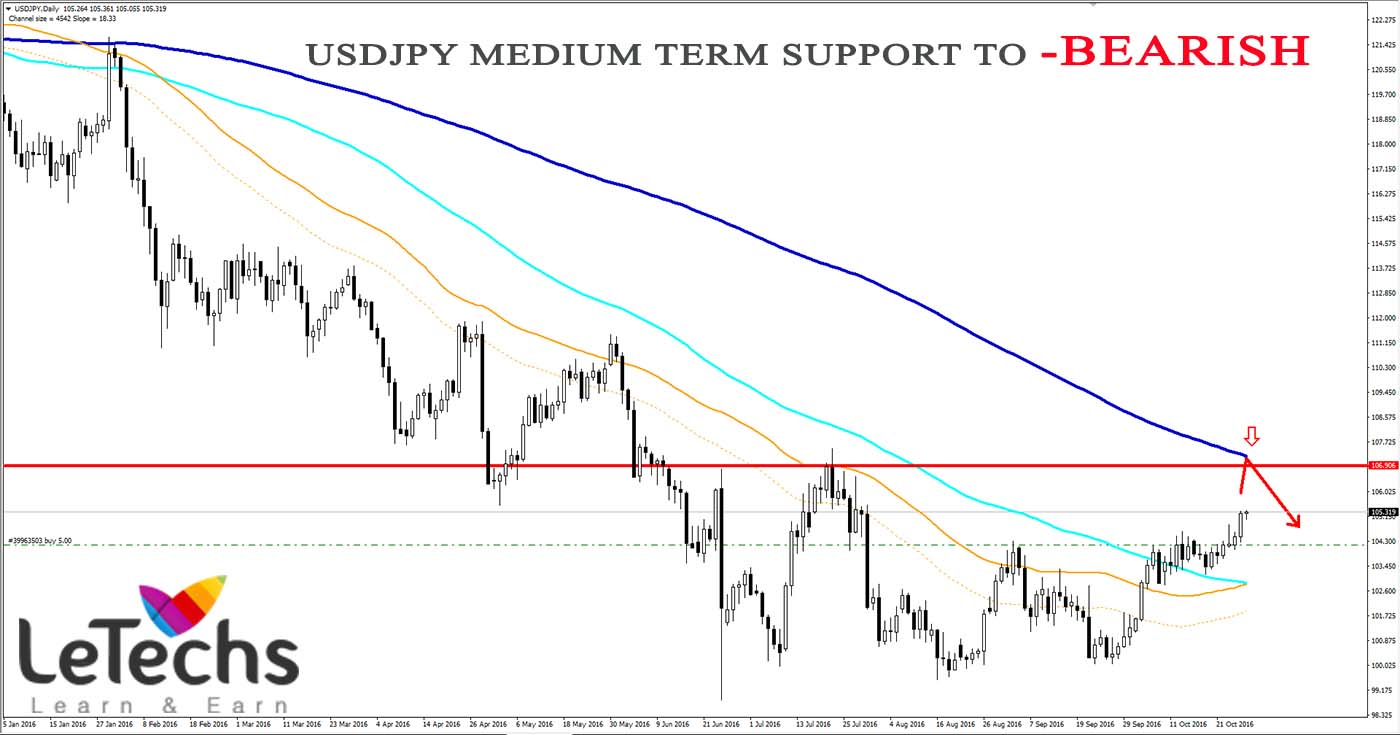
USDJPY
The dollar stays around 3-month highs across the yen. The US treasury yields strengthening and expectations over the Fed rate-hike support the US dollar across the board. The dollar grew above the yen on last day. The pair reversed all its losses which it had suffered the previous day. The value stayed in an upward channel. The pair bounced off its lowest limit & jumped towards 105.00 levels throughout the course of the day. The value developed well over the moving averages which are all directing higher in the 4HR chart.
The resistance appears in 105.00 levels, the support stands in 104.50 levels. Indicator MACD has formed signal to rise. The RSI oscillator continues consolidating within the overbought region.
XAUUSD
The yellow metal strengthened on last day as the volatility over the timing of future rate hike and the next US presidential election of 2016 promote the safe-assets demand. Besides, the metal prices extended their gains following the depressed US durables goods data. The yellow metal prices slightly modified throughout the day, remaining around 1270 levels. The value was inactive following a sharp decrease on mid-week. The pair slightly grew from 1265 to 1270 levels, reversing a tiny portion of its new losses. The pair tested the level of 1270 before the US session. The pair stayed between the 50 EMAs and 100 EMAs in the 4HR chart. The 50 and 100 EMA remains neutral, while the 200-EMA is directing lower.
The resistance will be at 1270 levels, the support stays in at 1260 levels. MACD indicator is at the centerline. If the histogram moves into the negative zone that will indicate sellers growing strength. If MACD comes back into the positive zone the buyers will take the market control. RSI stands within the neutral region.
Share This Post
 0
0
 0
0
 0
0


Categories
Forex Technical outlook
Forex Fundamental Outlook
Learn Forex Trading
Forex trading psychology
Forex technical indicator
General News

Popular

Why we choose Forex Market?
Oct 06 , 2015

Forex, Commodity and Binary Trading Signals on 5th May 2016
May 04 , 2016

Forex Trading Terminologies
Oct 21 , 2015

Recent

Forex Weekly Technical Outlook on 7-11 August 2017
Aug 07 , 2017

Forex Weekly Technical Outlook on 24-28 JULY 2017
Jul 24 , 2017

Forex Weekly Technical Outlook on 12 JUNE 2017
Jun 12 , 2017
Archives
August 2017
July 2017
June 2017
May 2017
April 2017
March 2017
February 2017
January 2017
December 2016
November 2016
October 2016
September 2016
August 2016
July 2016
June 2016
May 2016
April 2016
March 2016
February 2016
December 2015
November 2015
October 2015
September 2015
July 2017
June 2017
May 2017
April 2017
March 2017
February 2017
January 2017
December 2016
November 2016
October 2016
September 2016
August 2016
July 2016
June 2016
May 2016
April 2016
March 2016
February 2016
December 2015
November 2015
October 2015
September 2015


