


26
Oct
Daily Technical Analysis on 26 October 2016
Today’s Technical Pairs: EURUSD, GBPUSD, USDJPY & XAUUSD.
EURUSD
The pair was little modified on yesterday despite solid Business Climate & Expectations in Germany. The common currency stays under the level 1.0900 throughout the day. The value traded in a tight range between the mark level of 1.0865 - 1.0900. The pair remained below the 50-EMAs in the 1HR chart. The 50-EMAs acted as a resistance for the value, ignoring its attempts to gain. The 50, 100 and 200 EMAs kept moving lower in 1HR chart.
The resistance remains in 1.0900 levels, the support lies in 1.0830 levels. MACD remained in the negative zone grew which hints the seller’s positions weakening. The RSI is within the oversold region.
GBPUSD
There were no major economic releases in the UK. The BOE's Governor Carney statement was the key event on last day. Sellers constantly dominate in the market on yesterday. The pair stays below the pressure in a tight range, trading some pips above 1.2100 levels. The pair was intermediate between 50 and 100 EMAs in the 1HR chart. The 100-EMAs give a solid resistance and limited the pound additional recovery. The 50, 100 and 200 EMAs slowed down their decreases. All moving averages are directing lower.
The resistance seen at 1.2200 levels, the support stands at 1.2100 levels. MACD indicator is at the centerline which enters the negative zone that will indicate sellers growing strength. If MACD comes back into the positive zone the buyers will take the market control. Indicator RSI is within the neutral region. Currently, the pair short-term outlook was Bearish. After breaking the level of 1.2200 will drive towards 1.2100 levels.
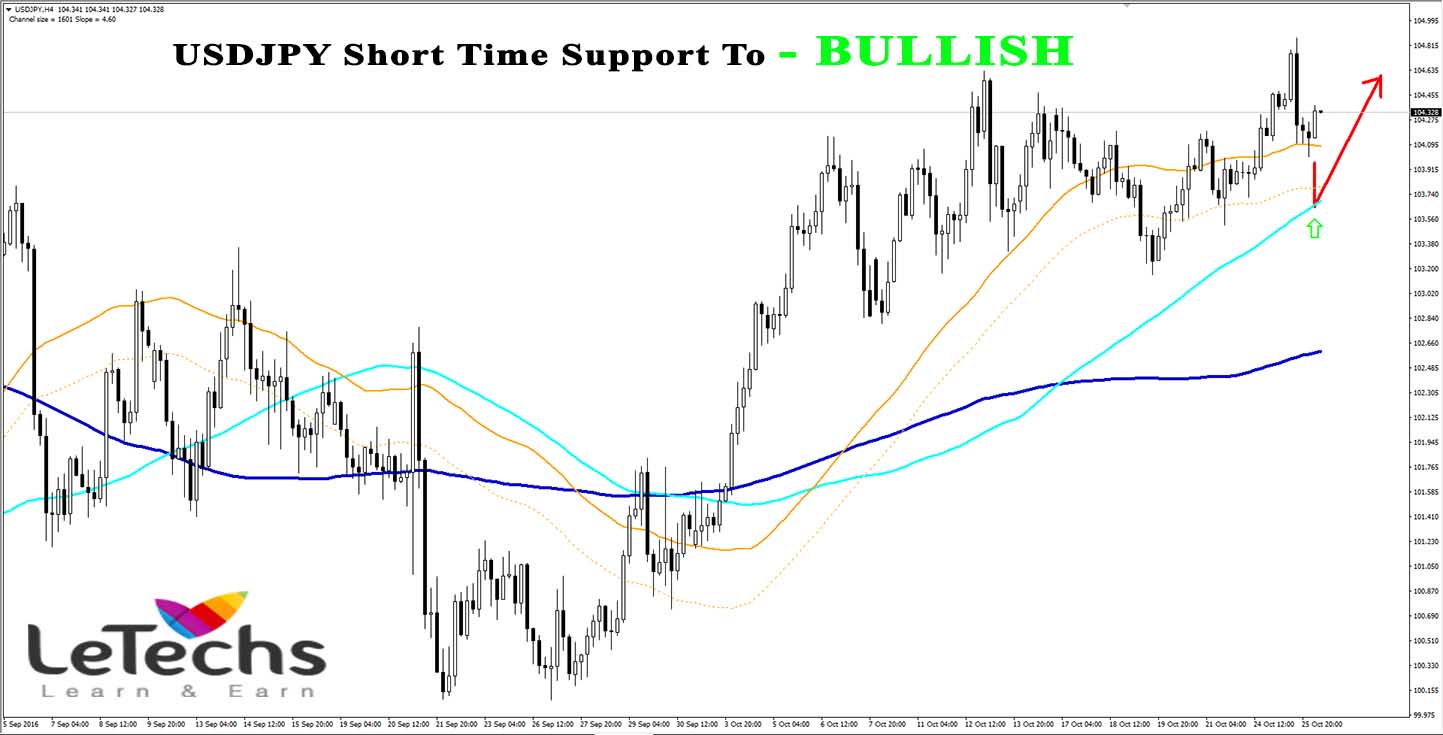
USDJPY
The improved investor’s appetite for riskier capitals weighed on the yen, maintaining its solid demand tone. The pair looked very bullish on Tuesday. The pair remained in an ascending channel, trading nearly its 2-week highs. The USDJPY extended its gains and grew from 104.11 levels to 104.60 levels. The value is over the moving averages in the 4HR chart. The moving averages handled their bullish slope.
The resistance comes in 104.60 levels, the support finds in 104.00 levels. The MACD histogram grew which hints the buyer’s power. RSI oscillator stands close to the overbought levels. The pair approached the overbought region where the value turned around earlier time. The value will stay under buying pressure until it holds over the 103.60 levels. We advise a short-term decrease back to the 104.00 levels - 103.70 support levels.
XAUUSD
The yellow metal futures edged higher on yesterday; still, its growth was limited by a stronger dollar. The US dollar strengthened following the Fed’s official hawkish remarks about a rate hike this December. The pair traded horizontal on last day. The price remains between the 1270 and 1260 levels throughout the day. The metal prices struggled to find support around 1260 levels. Sellers lost to crack the level and the gold bounced upwards and regained to the upper boundary of the range.
The pair rebound from the 50-EMAs and headed towards the 100-EMAs in the 4HR chart. The 50-EMA remains neutral, the 100 and 200 EMAs slowed down their decrease. The resistance seems at 1270 levels, the support lies at 1260 levels. The MACD histogram grew which indicates the buyer’s increase. RSI oscillator remained in overbought levels, favoring a fresh move lower.
Share This Post
 0
0
 0
0
 0
0


Categories
Forex Technical outlook
Forex Fundamental Outlook
Learn Forex Trading
Forex trading psychology
Forex technical indicator
General News

Popular

Why we choose Forex Market?
Oct 06 , 2015

Forex, Commodity and Binary Trading Signals on 5th May 2016
May 04 , 2016

Forex Trading Terminologies
Oct 21 , 2015

Recent

Forex Weekly Technical Outlook on 7-11 August 2017
Aug 07 , 2017

Forex Weekly Technical Outlook on 24-28 JULY 2017
Jul 24 , 2017

Forex Weekly Technical Outlook on 12 JUNE 2017
Jun 12 , 2017
Archives
August 2017
July 2017
June 2017
May 2017
April 2017
March 2017
February 2017
January 2017
December 2016
November 2016
October 2016
September 2016
August 2016
July 2016
June 2016
May 2016
April 2016
March 2016
February 2016
December 2015
November 2015
October 2015
September 2015
July 2017
June 2017
May 2017
April 2017
March 2017
February 2017
January 2017
December 2016
November 2016
October 2016
September 2016
August 2016
July 2016
June 2016
May 2016
April 2016
March 2016
February 2016
December 2015
November 2015
October 2015
September 2015


