


27
Sep
Daily Technical Analysis on 27th September 2016
Today’s Technical Pairs: EURUSD, GBPUSD, USDJPY, XAUUSD.
EURUSD
The euro got some gain on the rear of the solid Germany statistics. The pair stayed in a stiff range among a risk aversion on yesterday. The euro conserved its positive near-term tone on last day. The pair kept regaining after rebound from the level of 1.1200. The value approached the 1.1250 level in the mid of the European session and broke it at the beginning of the US session.
The 50, 100 and 200 EMAs are remains neutral. All EMAs act as a support for the quotes. The resistance comes at 1.1300 levels, the support remains in 1.1250 levels. Indicator RSI surrounded the overbought zone. A clear smash over the level of 1.1250 will hint the growing buyers’ strength. Buyers will advance the value towards the nearby resistance levels at 1.1300.
GBPUSD
The dollar still under pressure against its key rivals as stocks kept depressing the fresh Fed’s decision. Also, traders were cautious before the US President Elections. The downside pressure persisted on yesterday. The pair cleaned all its Friday’s growth and sharply cut down from the local high towards the next level supports at 1.2900. The value hangs in post-Brexit short-term consolidation.
The 50, 100 and 200 EMAs handled its bearish slope and widen their declines in the 4HR chart. The current resistance appears in 1.3000, the support remains in 1.2900 levels. MACD indicator decreased which confirms the strength of sellers. RSI indicator consolidated within the negative region.
USDJPY
The yen will strong as a safe asset among a risk aversion. The Kuroda's chief of BoJ words that the controller was ready to implement further measures to boost inflation failed to limit the gain of the yen. The risk-off sentiment supported the requirement for the yen. The price slid downsides from the Asian session high at 101.00 levels towards the quick support at 100.40 levels where the downside pressure faded.
The 50, 100 and 200 EMAs increased their declines. All moving averages keep moving lower in the 4HR chart. The resistance seems at 101.40 levels, the support exist in 100.40 levels. The indicators sustained moving south within negative region. MACD indicator stands at the same level which confirms the seller’s strength. Indicator RSI stays over the oversold region. USDJPY overall scenario was Bearish.
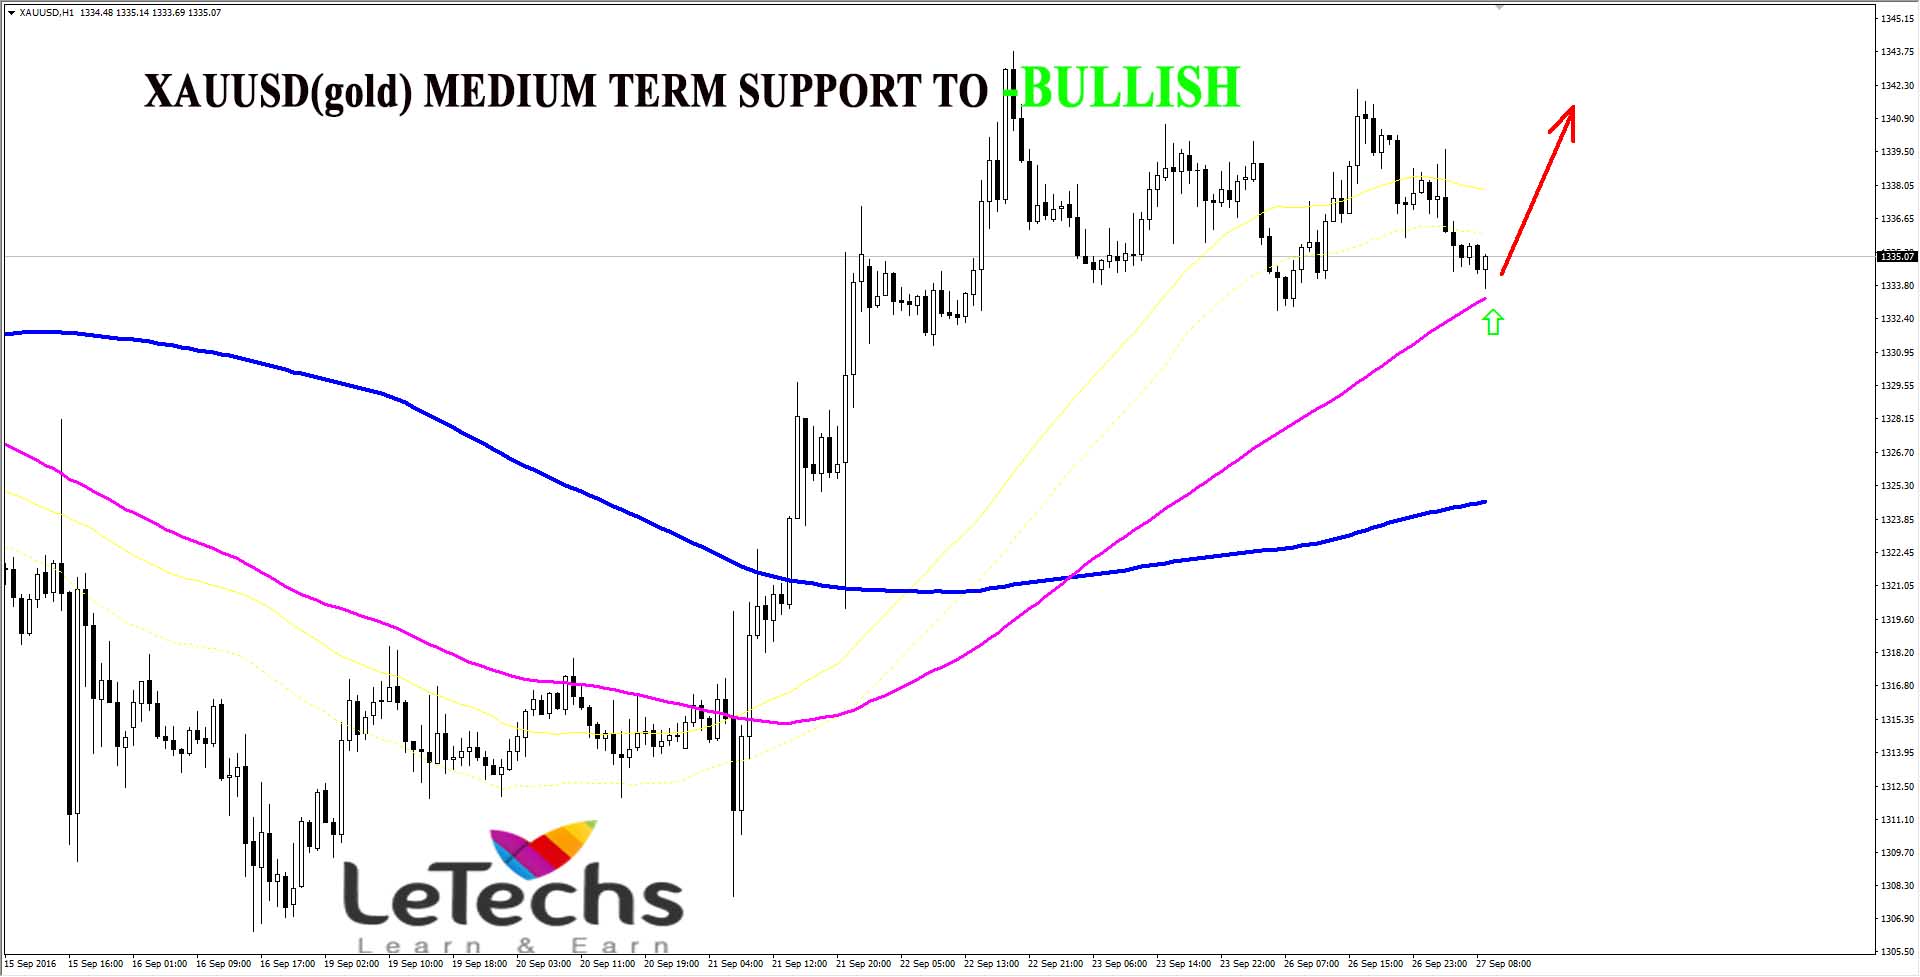
XAUUSD
The yellow metal shows blended trades on yesterday. Traders took hold mode ahead of the Presidential debates between Hillary Clinton and Donald Trump. The metal prices traded quotes remains in a tight range between 1332 and 1340 levels. After rolling rear the value again tried to overcome 1340 levels. Still, the pair got below selling pressure on any upward movement towards the mark levels.
The 50-EMA is intersecting the 100 and 200 EMAs in the 4HR chart. The moving averages directs upwards in the 4HR chart. The resistance comes in 1340 levels; the support remains in at 1330 levels. MACD indicator is in the positive zone. RSI indicator consolidated nearly the overbought region.
Share This Post
 0
0
 0
0
 0
0


Categories
Forex Technical outlook
Forex Fundamental Outlook
Learn Forex Trading
Forex trading psychology
Forex technical indicator
General News

Popular

Why we choose Forex Market?
Oct 06 , 2015

Forex, Commodity and Binary Trading Signals on 5th May 2016
May 04 , 2016

Forex Trading Terminologies
Oct 21 , 2015

Recent

Forex Weekly Technical Outlook on 7-11 August 2017
Aug 07 , 2017

Forex Weekly Technical Outlook on 24-28 JULY 2017
Jul 24 , 2017

Forex Weekly Technical Outlook on 12 JUNE 2017
Jun 12 , 2017
Archives
August 2017
July 2017
June 2017
May 2017
April 2017
March 2017
February 2017
January 2017
December 2016
November 2016
October 2016
September 2016
August 2016
July 2016
June 2016
May 2016
April 2016
March 2016
February 2016
December 2015
November 2015
October 2015
September 2015
July 2017
June 2017
May 2017
April 2017
March 2017
February 2017
January 2017
December 2016
November 2016
October 2016
September 2016
August 2016
July 2016
June 2016
May 2016
April 2016
March 2016
February 2016
December 2015
November 2015
October 2015
September 2015


