


22
Sep
Daily Technical Analysis on 22nd September 2016
Today’s Technical Pairs: EURUSD, GBPUSD, AUDUSD, USDJPY, XAUUSD.
EURUSD
The BoJ decision doesn’t change the rate so did not cause the pair. The pair was unmoved throughout the European trade on yesterday as investors stay cautious before the Fed meeting results. The euro gets below selling force during the Asian session on last day. The lowest trading value was marked at the level of 1.1120 since late August. The values turned around and regain rear to the starting level – 1.1150 in the mid of the earlier night session.
The 50-EMA intersects the 100-EMA downwards and currently crossing the 200-EMA. All moving averages are driving downwards which confirms the strength of sellers. The resistance finds at 1.1150 levels, the support remains at 1.1100 levels. MACD stays in the negative region. RSI indicator consolidated within the oversold zone. The pair will mostly depend on the US results on last day. If the Fed hikes the rates the value might reduce additionally down towards 1.1100 and 1.1050. If the US Central Bank unchanged its rates the euro might strengthen towards 1.1200 and 1.1250 levels.
GBPUSD
The pound weakened across the dollar despite the positive UK data on yesterday. Traders hold for the Fed decision about the rates later that day. The pair looks to sustain with the recovery in the European session. The value rebound from the boarder of the oversold region. The sterling was adept to wipe out few loses twisting higher. The pair traded close to the 1.3000 levels in the mid of the European trade on previous day.
The 50, 100 and 200 Day EMAs handled their bearish slope. All moving averages keep moving lower. The resistance comes at 1.3000 levels, the support finds in 1.2870 levels. MACD indicator is in negative which confirms the seller’s side. RSI is in the oversold region. The pound might weaken on the rear of the Fed decision about the rates.
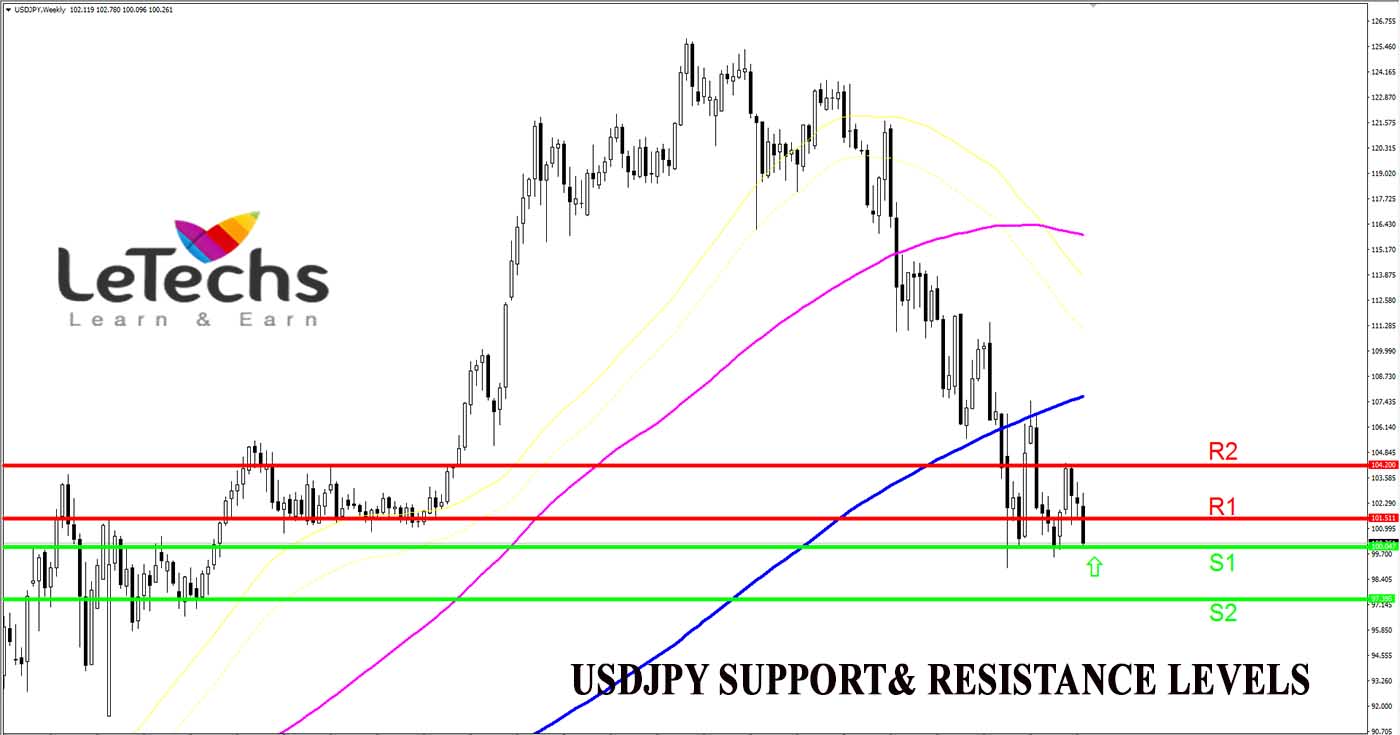
USDJPY
The dollar restored despite the BoJ decision of the unchanged rates this year. The pair traded blended on yesterday. The value cut down under the levels of 101.15 and after that sharply rallied in the Asian session. The pair driven towards the level of 102.50 where it struggle a short lived downward movement. The value currently with the 101.40 levels as struggled.
The pair remained under the 50, 100 and 200 EMAs in the 4HR chart. The moving averages shows slightly bearish slope. The resistance appears in 101.40 levels, the support seems at 100.40 levels. Indicator MACD is negative which confirms the seller’s side. RSI indicator is in the oversold region.
AUDUSD
The pair grew on the rear of the oil prices growth. The pair had a good day on yesterday. Following a brief consolidation the pair resumed its short-term bullish movement. The value has been regained for the third session in a row. The pair clogged a few pips under the level of 0.7600 in the European session.
The gauge broke the 100 and 200 EMAs upside in the 4HR chart. The moving averages act as a support for the Aussie dollars currently. The 200 and 100 EMAs remain neutral, but the 50-EMA is directing higher. The resistance comes in 0.7600, the support stands at 0.7540 levels. Indicator MACD is in the positive area which hints the buyers’ strength. RSI indicator is within the overbought zone.
XAUUSD
The yellow metal futures grew to the 1-week high when the BoJ released the fresh monetary policy measures. The metal retreated from the weekly low in the Asian session. The value rallied and was adept to crack the level of 1320. The pair currently looks to be moving towards its quick resistance at 1330 levels.
The pair broke the 50, 100 and 200 EMAs upsides in the 4HR chart. The moving averages are twisting upside directions. The resistance remains at 1330, the support stays in 1320 levels. MACD indicator is at the centerline which enters the positive zone that will hint buyers’ strength. If MACD comes back into the negative zone the sellers will take the market control. RSI indicator is surrounding the overbought region.
Share This Post
 0
0
 0
0
 0
0


Categories
Forex Technical outlook
Forex Fundamental Outlook
Learn Forex Trading
Forex trading psychology
Forex technical indicator
General News

Popular

Why we choose Forex Market?
Oct 06 , 2015

Forex, Commodity and Binary Trading Signals on 5th May 2016
May 04 , 2016

Forex Trading Terminologies
Oct 21 , 2015

Recent

Forex Weekly Technical Outlook on 7-11 August 2017
Aug 07 , 2017

Forex Weekly Technical Outlook on 24-28 JULY 2017
Jul 24 , 2017

Forex Weekly Technical Outlook on 12 JUNE 2017
Jun 12 , 2017
Archives
August 2017
July 2017
June 2017
May 2017
April 2017
March 2017
February 2017
January 2017
December 2016
November 2016
October 2016
September 2016
August 2016
July 2016
June 2016
May 2016
April 2016
March 2016
February 2016
December 2015
November 2015
October 2015
September 2015
July 2017
June 2017
May 2017
April 2017
March 2017
February 2017
January 2017
December 2016
November 2016
October 2016
September 2016
August 2016
July 2016
June 2016
May 2016
April 2016
March 2016
February 2016
December 2015
November 2015
October 2015
September 2015


