


31
Aug
Daily Technical Analysis on 31 August 2016
Today’s Technical Pairs: EURUSD, GBPUSD, USDJPY, and XAUUSD.
EURUSD
The dollar is solid due to the latest J.Yellen’s comments regarding the growth possibility of the Fed rate hike. The pair traded closely the new lows. Traders were immobile before the upcoming statistics in the US. The value remains under the broken 200-EMA & Currently the support levels at 1.1150 in the 4HR chart. The 200-EMA still neutral in position, but the 50 and 100 Day EMAs are driving downwards. Also the 50, 100 and 200 EMAs gives a solid bearish slope in the 1HR chart. The 50 and 100 Day EMAs are intersecting the 200-EMA downsides. The resistance comes in 1.1200 levels, the support remains at 1.1130 levels.
The moving average provides a sell signal. The indicator MACD and RSI stays horizontal within negative region, handling the risk towards the downwards. Overall trend is certainly bearish.
GBPUSD
Pound weakened on Tuesday after the release of the weak data. At the mean time the US is strong on the rear of the predictions that the Fed will raise the rate this year. The pair fell back towards its weekly low on the yesterday trades; yet, the sterling attained few of its losses in the US Session. The resistance level is 1.3200, the support levels are 1.3100.
The indicators MACD and RSI both negative. MACD signs a sell signal. The RSI rebound from the oversold region. The value recurred under the 50-EMA in the 4HR chart. The 50 and 100 EMAs are driving nearly to one other in the 4HR chart. All lines are driving downsides & sign a sell signal.
USDJPY
The pair grew on Tuesday when Household Spending did not appropriate traders’ anticipations. Besides, fair Consumer Confidence index strengthened the dollar beyond the board. The pair traded closely new three-week highs. The growth of the dollar constant, the instrument accelerated its hike. The resistance finds in 103.50, the support stays in 102.50 levels.
MACD and RSI are horizontal within positive area in the 4HR chart. The price leads north from the 200-EMA in the 4HR chart. Currently there are few risks towards the upside. The pair is oversold now, still we consider an upwards any moment.
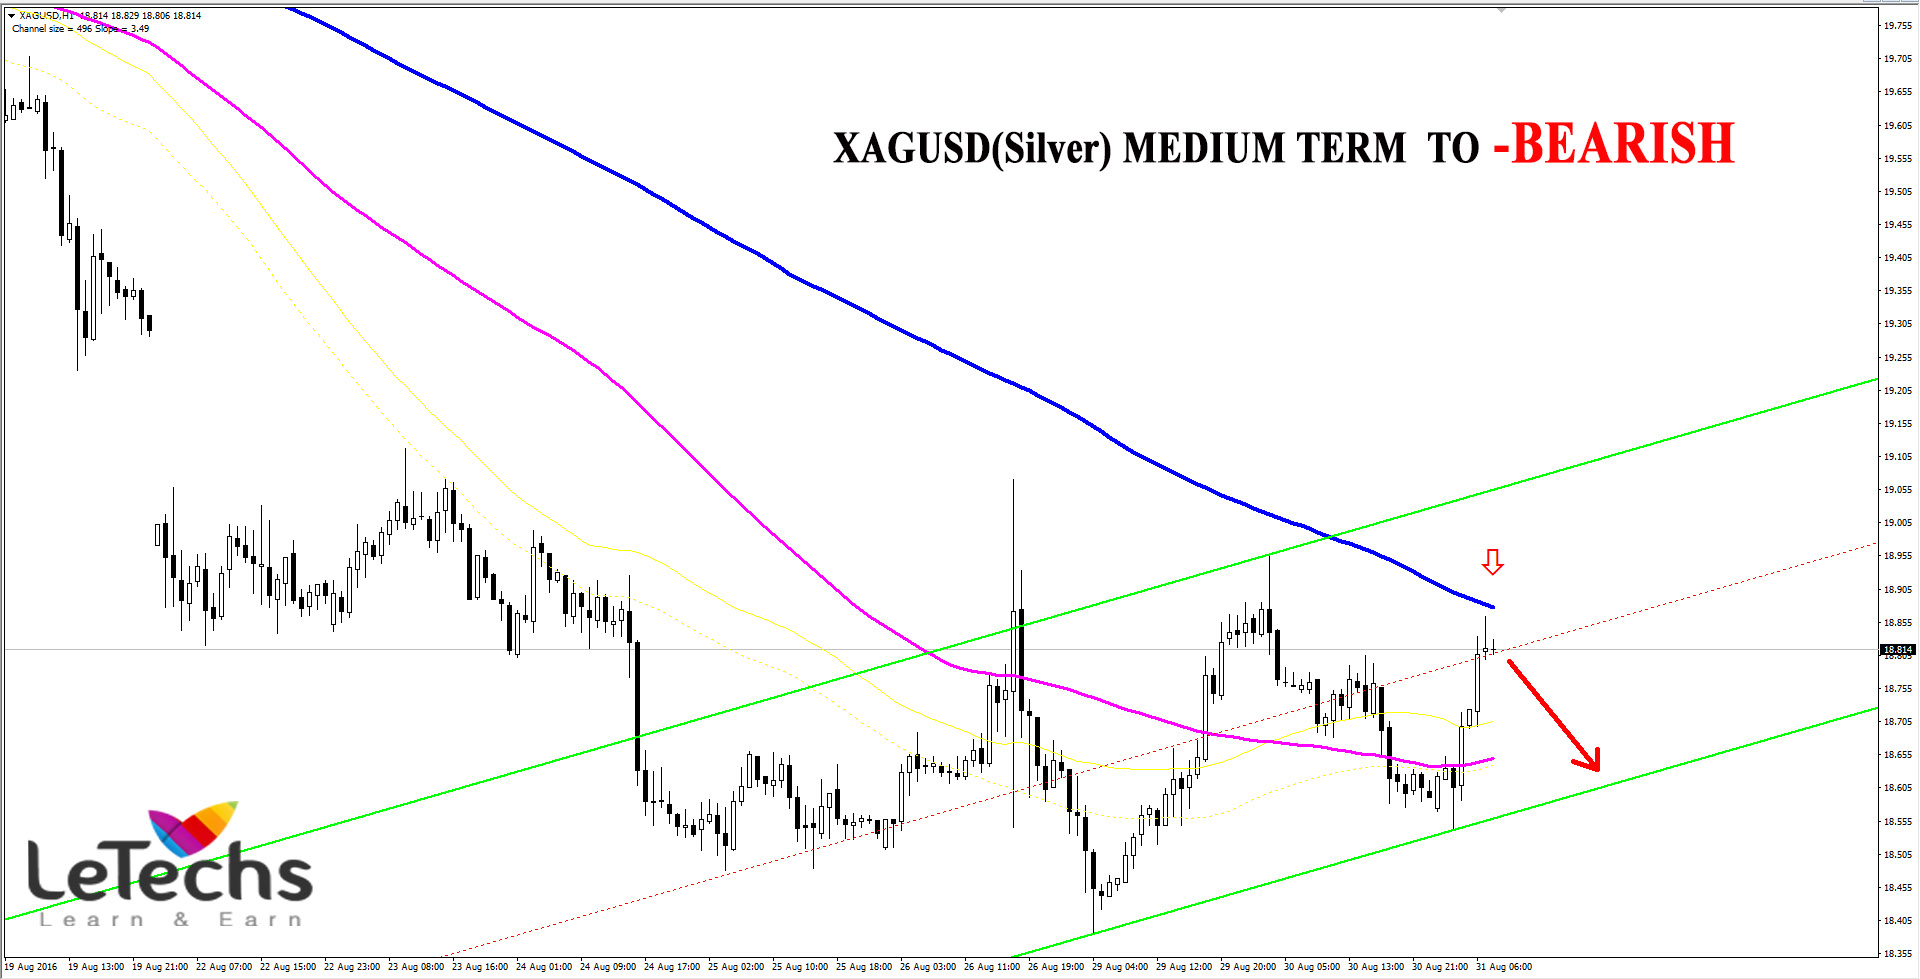
XAUUSD
The yellow metal softened due to the fresh Fed officials’ remarks regarding the next US rate hike. The trend is still negative in the market place, the yellow metals ended bearish on Tuesday. Sellers met a strong support at the 1316 levels which were not adept to smash at once. The value rolled rear to 1325.40 where the pair twisted surround and returned rear to the support level. The resistance remains in 1330, the support stays at 1316 levels.
The MACD stayed at the current level which certifies the seller’s strength. RSI consolidated close to the oversold zone. The 50, 100 and 200 EMAs give a solid bearish ramp. The moving averages are driving downside signs a sell signal.
Share This Post
 0
0
 0
0
 0
0


Categories
Forex Technical outlook
Forex Fundamental Outlook
Learn Forex Trading
Forex trading psychology
Forex technical indicator
General News

Popular

Why we choose Forex Market?
Oct 06 , 2015

Forex, Commodity and Binary Trading Signals on 5th May 2016
May 04 , 2016

Forex Trading Terminologies
Oct 21 , 2015

Recent

Forex Weekly Technical Outlook on 7-11 August 2017
Aug 07 , 2017

Forex Weekly Technical Outlook on 24-28 JULY 2017
Jul 24 , 2017

Forex Weekly Technical Outlook on 12 JUNE 2017
Jun 12 , 2017
Archives
August 2017
July 2017
June 2017
May 2017
April 2017
March 2017
February 2017
January 2017
December 2016
November 2016
October 2016
September 2016
August 2016
July 2016
June 2016
May 2016
April 2016
March 2016
February 2016
December 2015
November 2015
October 2015
September 2015
July 2017
June 2017
May 2017
April 2017
March 2017
February 2017
January 2017
December 2016
November 2016
October 2016
September 2016
August 2016
July 2016
June 2016
May 2016
April 2016
March 2016
February 2016
December 2015
November 2015
October 2015
September 2015


