


21
Jul
Daily Technical Analysis on 21 July 2016
Technical Pairs: EURUSD, GBPUSD, NZDUSD, USDJPY, Brent- Crude oil & GOLD.
EURUSD
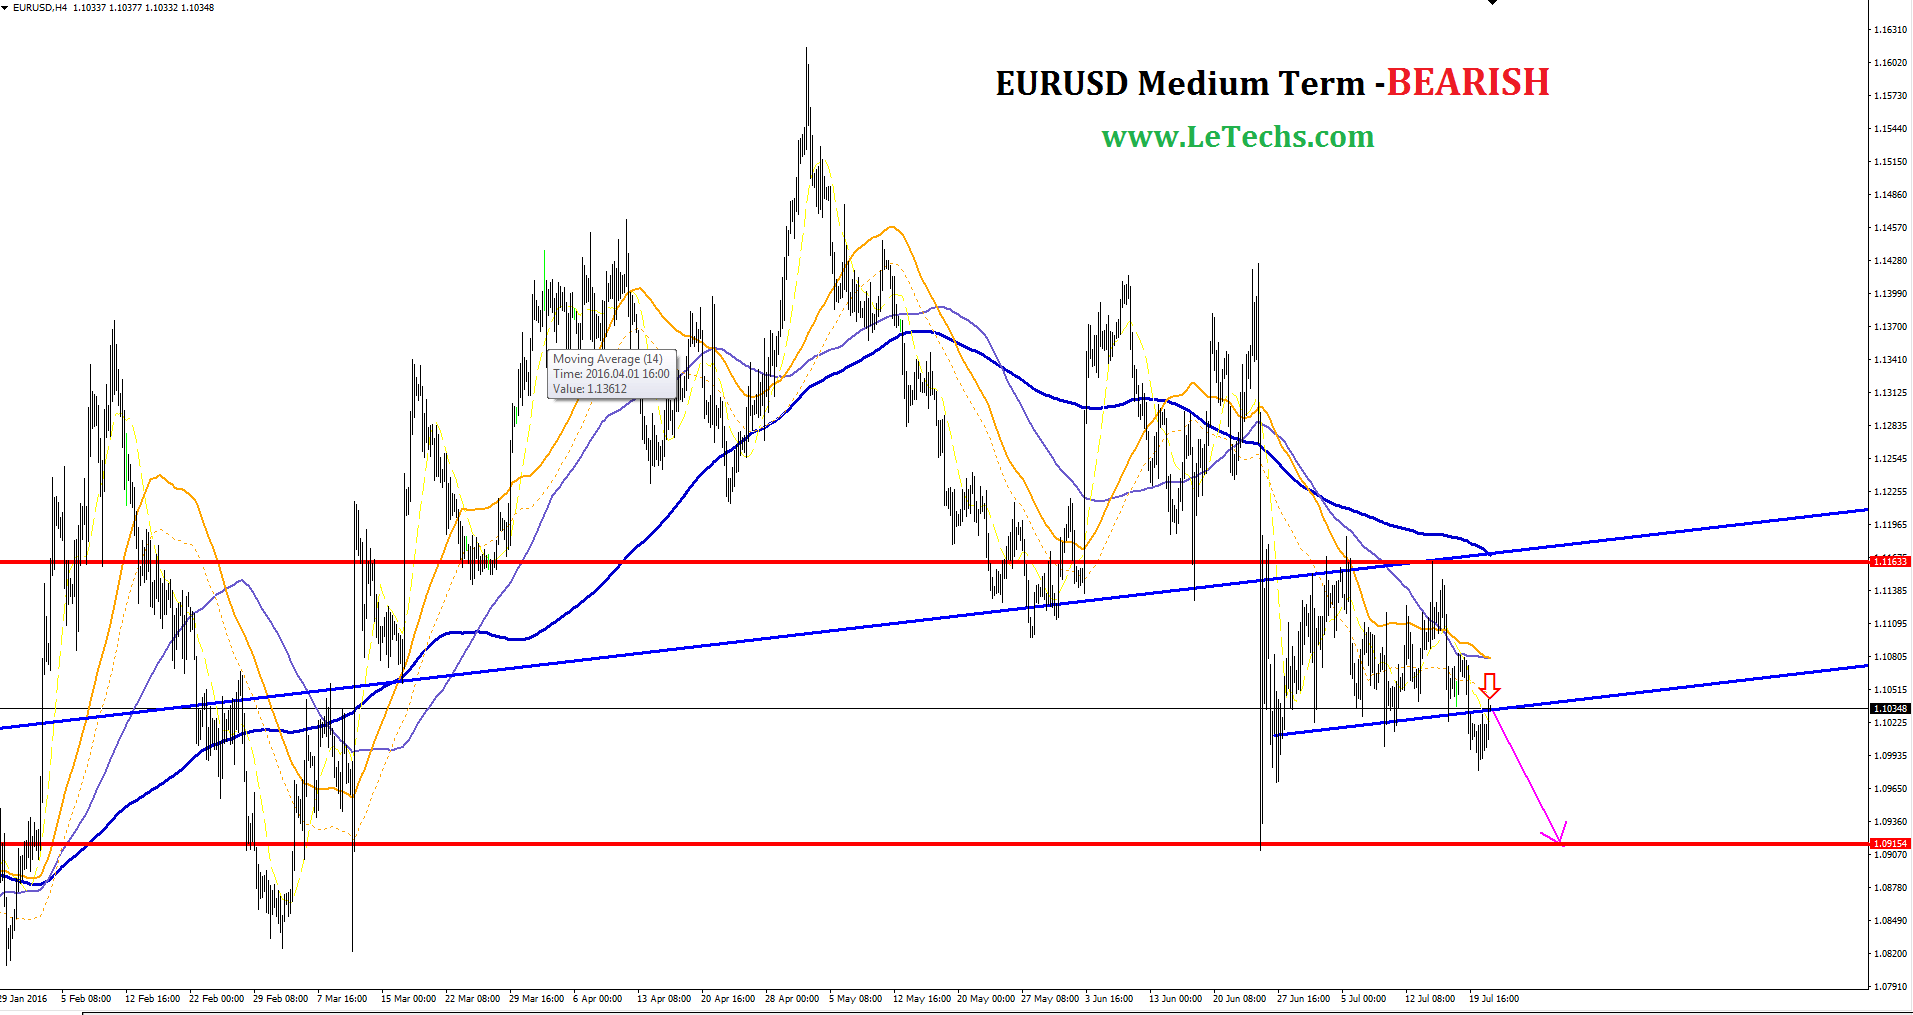
The main drifters for the dollar were: Housing Starts & positive Building Permits in the US & the Fed representative Dennis P. Lockhart’s statement. According to Dennis P. Lockhart the Brexit did not blow much the US economy. Besides, the chances that the US controller will raise the rate this year keep growing. EURUSD pair remained below the pressure line. Euro struggled to attain the 1.1000 levels but decline. All its attempts to improve were limited by the mark level of 1.1030. The gauge stayed its lower limit in the descending channel. The resistance level was 1.1050, the support levels are 1.1000.
The value is under the bearish 50-EMA which yet acts as a resistance in the 4HR chart. The moving averages of 50, 100 and 200 are moving downsides which signs a sell signal. The pair blocked at the solid support levels at 1.1000. See if the EURUSD crack the level downsides the pair will reduce to 1.0900 levels.
GBPUSD
The strong UK employment promoted the pound. Unemployment Rate cut down, at the mean time Claimant Count Change will grow. Technically, the pair stayed below pressure. GBPUSD pair rebound creates a daily low of 1.3100, supported by a solid UK unemployment report. The instrument will grow by 0.45 percent throughout the course of the day. At present 1.3200 is the local high. The current resistance seems at 1.3300, the support seems at 1.3100 levels.
RSI bounce back from the oversold region which signs a buy signal. The price grows & blocked at the 50-EMA in the 4HR chart. The 50-EMA and the 100-EMA are flat in position, the 200-EMA directs downwards. The pair looks to find a strong support at the same level 1.3100. If the pair cracks the level downsides, the decline will be constant to 1.2900. Or else, a growth towards 1.3300 levels we see.
NZDUSD
NZD declined on the news that the RBNZ will diminish its monetary policy next month. The entire kiwi traded weaker on Yesterday. The pair stands in the descending channel. Kiwi creates a support at the level of 0.7020. The resistance appears in 0.7050, the support appears in 0.6950 levels.
Decreased MACD is in the negative zone which hints the sellers’ spot strengthening. RSI is nearly the oversold territory which also signs a sell signal. In the 4HR chart shows that the instrument is just under the 200-EMA. The 50-EMA smashed the 100-EMA downsides which will be a sell signal. The 50 and 100 EMAs are driving downwards, but the 200-EMA is flat currently. If the NZDUSD pair does form a breakout at 0.7020 levels the instrument might reduce to 0.6950. The buyers’ nearby target stands at 0.7100 levels.
USDJPY
The yen was adept to grow across the other major currencies. Investors used the yen as safe capitals when Tokyo bonds market weakened following a last six days rally. Although the pair grew Wednesday its rally imply to run out of force as the USDJPY surround a solid resistance levels at 107.00. The index set new four-week highs at the mark level of 106.85. The resistance comes in 107.00 levels, the support lies in 106.00 levels.
MACD stands in the positive region which indicates the buyers’ spot strength. RSI is near to the overbought zone which signs a buy signal. The price stays over the bullish 50-EMA in the 1HR chart. The moving averages of 50, 100 and 200 are yet moving upside which also signs a buy signal. The pair surrounds 107.00 levels; a cut through present will target it at the 108.00 level. Alternatively, the pair might fall back to 104.50 levels.
BRENT- Crude Oil
The Brent gets some support from the Weekly Crude Oil Stock report in the US. The US Oil Stocks have been reducing the 9-week in a row. The crude oil Brent stands in the descending channel, the value surrounds its upper limit. Since Mid-June the Brent is in downtrend channel. The resistance seems at 47.50, the support appears at 46.50 levels.
All the indicators are in the neutral zone. The price smashed the 50-EMA upsides in the 4HR chart. Yet, the value did not hold there & cut down below of it. The moving averages of 50, 100 and 200 are driving downwards in the 4HR chart. We consider a bearish scenario for the Brent. We predict the trades between the 47.50 & 46.50 levels.
XAUUSD - GOLD
The gold futures declined as the solid dollar undermined the allure of the yellow metal. The metal futures were adept to crack the level 1330 & reduced towards the next support levels at 1316. A fresh local low is at the mark level of 1312. The pair lost regarding 1.10 percent throughout the course of the trades. The resistance comes at 1330, the support remains in 1316 levels.
Decreased MACD is in the negative territory which hints the sellers’ positions strength. RSI indicator is nearly the oversold region which will be a sell signal. The value broke downsides the 50 and 100 EMAs in the 4HR chart. Currently the value is in-between the 100-EMA & the 200-EMA. But the 50-EMA is drifting downwards; the 100 and 200 EMAs are flat in position. The pair left trailing another support on its path down. The closest sellers’ target stays at the level 1309. The value might bounce back from the level of 1308 in the 200 EMA & might return to the gain.
Share This Post
 0
0
 0
0
 0
0


Categories
Forex Technical outlook
Forex Fundamental Outlook
Learn Forex Trading
Forex trading psychology
Forex technical indicator
General News

Popular

Why we choose Forex Market?
Oct 06 , 2015

Forex, Commodity and Binary Trading Signals on 5th May 2016
May 04 , 2016

Forex Trading Terminologies
Oct 21 , 2015

Recent

Forex Weekly Technical Outlook on 7-11 August 2017
Aug 07 , 2017

Forex Weekly Technical Outlook on 24-28 JULY 2017
Jul 24 , 2017

Forex Weekly Technical Outlook on 12 JUNE 2017
Jun 12 , 2017
Archives
August 2017
July 2017
June 2017
May 2017
April 2017
March 2017
February 2017
January 2017
December 2016
November 2016
October 2016
September 2016
August 2016
July 2016
June 2016
May 2016
April 2016
March 2016
February 2016
December 2015
November 2015
October 2015
September 2015
July 2017
June 2017
May 2017
April 2017
March 2017
February 2017
January 2017
December 2016
November 2016
October 2016
September 2016
August 2016
July 2016
June 2016
May 2016
April 2016
March 2016
February 2016
December 2015
November 2015
October 2015
September 2015


